10.4 Extract relevant information and statistics about the risk of processing by using the TPOmap Dashboard
10.4.1 Provide a clear status of your DPIA’s implementation status and the Risk analysis performed
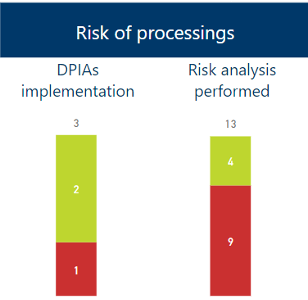
The metrics that are important for the Module 3 – Risk of processing are the following:
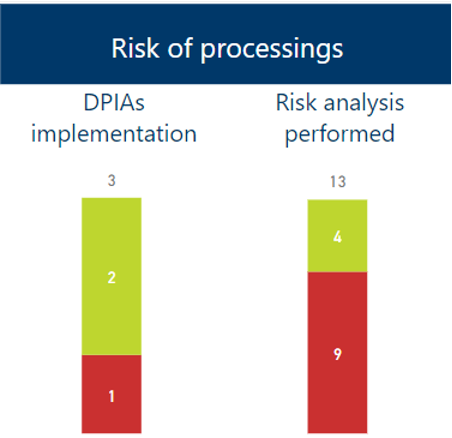
These metrics show two important counters:
- DPIAs implementation status
This counter will display the number of Data Protection Impact Assessments already realised out of the total number of DPIAs normally required for each high risk level processings.
Realising DPIAs and recording this information in the corresponding Processing sheets Chapter 11 – Risks to rights and freedoms in the DPIA Done cell will raise this counter.
- Risk analysis performed
This counter will display the number of risk analysis already realised out of the total number or processing sheet.
Realising Risk analysis and recording this information in the corresponding Processing sheets Chapter 11 – Risks to rights and freedoms by responding to the questions regarding the applicability – or not – of the legal risk factors and of the whitelist or blacklist will raise this counter.
As a standard, these counters take count of ALL Processing sheets.
It is however possible, thanks to the “Scope” menu of the Dashboard, to take only count of:
- The Records of a specific processing entity;
- The Records of validated or not validated Processing sheets ;
- The Records pertaining to one or more selected Processing sheets;
- The Records pertaining to a specific area of activities of your organization;
- The Records pertaining to processing activities that present a high level of risk;
- The Records pertaining to one or several data subjects;
- The Records pertaining to Processing sheets with a specific status.
For more information on how to use the “Scope” menu, please refer to Part 10.1.2.1.
10.4.2 Allow to easily select and download relevant information
By using the information displayed in this module, you will be able to:
- Identify processing activities likely to be of low, medium or high risk for individuals in accordance with applicable guidance from the authorities ;
- List processing activities for which a DPIA is required ;
- Identify the status of completion of required DPIAs ;
- Identify processing activities for which you still have to perform the risk analysis.
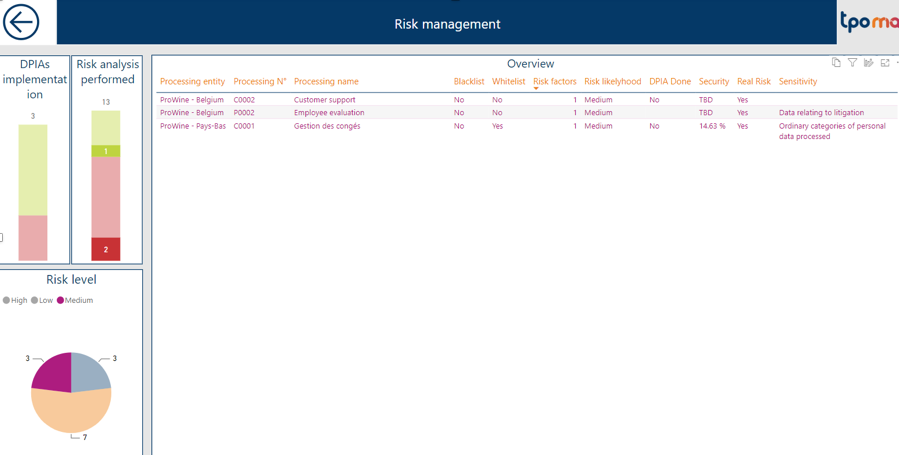
You can then prioritise your actions and make your processings safer by performing DPIAs accordingly. To access the information displayed in this module, please click on the “Risk of processings” title button of TPOmap Dashboard, you will be led to a window providing you with an overview of all the informations about the risks concerning the processing activities documented in your GDPR Record.
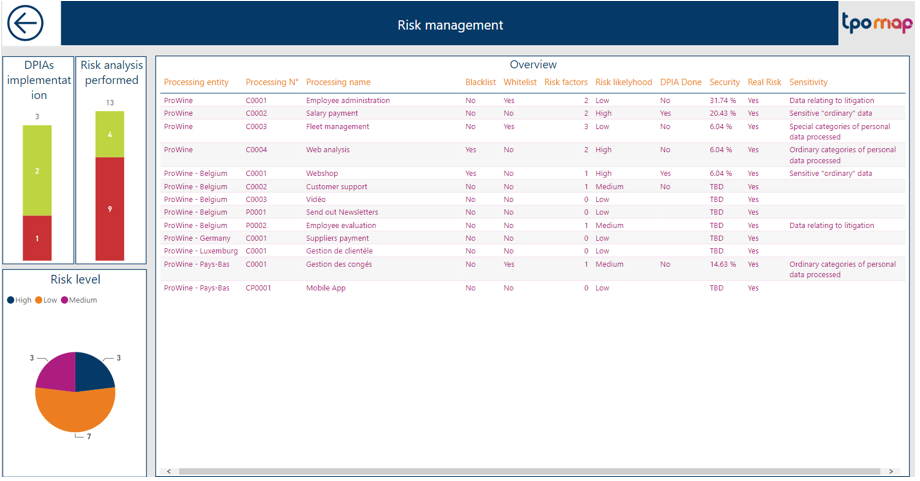
The Risk of processings Dashboard page will allow you to have an overview of thedetails of Risk level for each processing as well as the status of the Data Protection Impact Assessment (DPIA) (if applicable) for each processing.
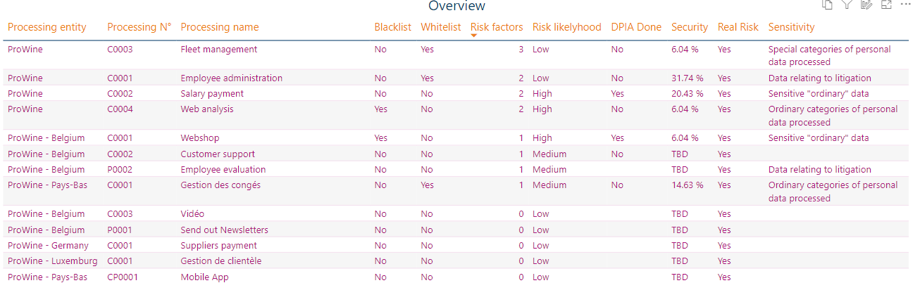
By clicking left on any of the columns name in the overview window, you can order the list by the corresponding category.
Example: List of processings ordered by number of risk factors. In that case the processing C0003 Fleet management has the highest number of risk factors and being of high risk level would be recommended to be made a priority in regards to DPIA implementation.
If you want to have a more efficient view, it is possible to expand the overview window by using the focus mode.
Please refer to Part 10.2.2 for more information about the focus mode.
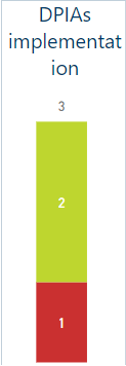
The left counter in the upper left windows will provide information on how many DPIAs have been already performed and recorded out of the total number of DPIAs normally required for all the processings involved.Example: In that case, 2 DPIAs for high risk processings out of 3 normally required have been already performed.
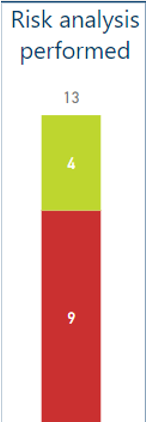
The right counter in the upper left windows will provide information on how many risk analyses2 have been performed out of the total number of processing sheet.
Example: In that case 4 risk analysis have been out of the 13 processing sheet.
By clicking on the relevant parts of the lower pie charts, you will be able to filter the list of processings in the overview window by the Risk level of your choice.
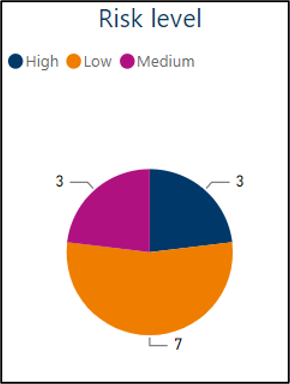
Example: List of processings displaying only the processings having a Medium risk level.
! Please note that only one filter can be applied at any time, by clicking on a new part of a pie chart, all previous filters will be cancelled to display the corresponding new one.
Please click once on the currently selected filter to cancel it and view the complete list of processings.
Thanks to the overview list, you can see – for every processing sheets – the following information:
- If a blacklist or whitelist is applicable ;
- The total number of risk factors applicable ;
- The risk level of the processing ;
- If the DPIA has been performed or not ;
- The security level of the processing – based on the implementation status of the security measures of each product involved in the processing activities ;
The sensitivity level of the data processed.

2 To perform a risk analysis, please respond the questions regarding:
- The applicability, or not, of the 9 legal risk criteria;
- The applicability, or not, of the applicable whitelist or blacklist.